Campaign Analytics
Table of Contents
Bevy Design’s campaign analytics tab shows analytics data for your campaigns. Using Campaign Analytics, you can measure the performance of each campaign and find out what works best for your business or Shopify store. The filter options located at the top of the Analytics screen can help you sort between different campaigns and different time periods.
The user will be rewarded with 50 free pageviews when entering the Analytics Dashboard for the first time.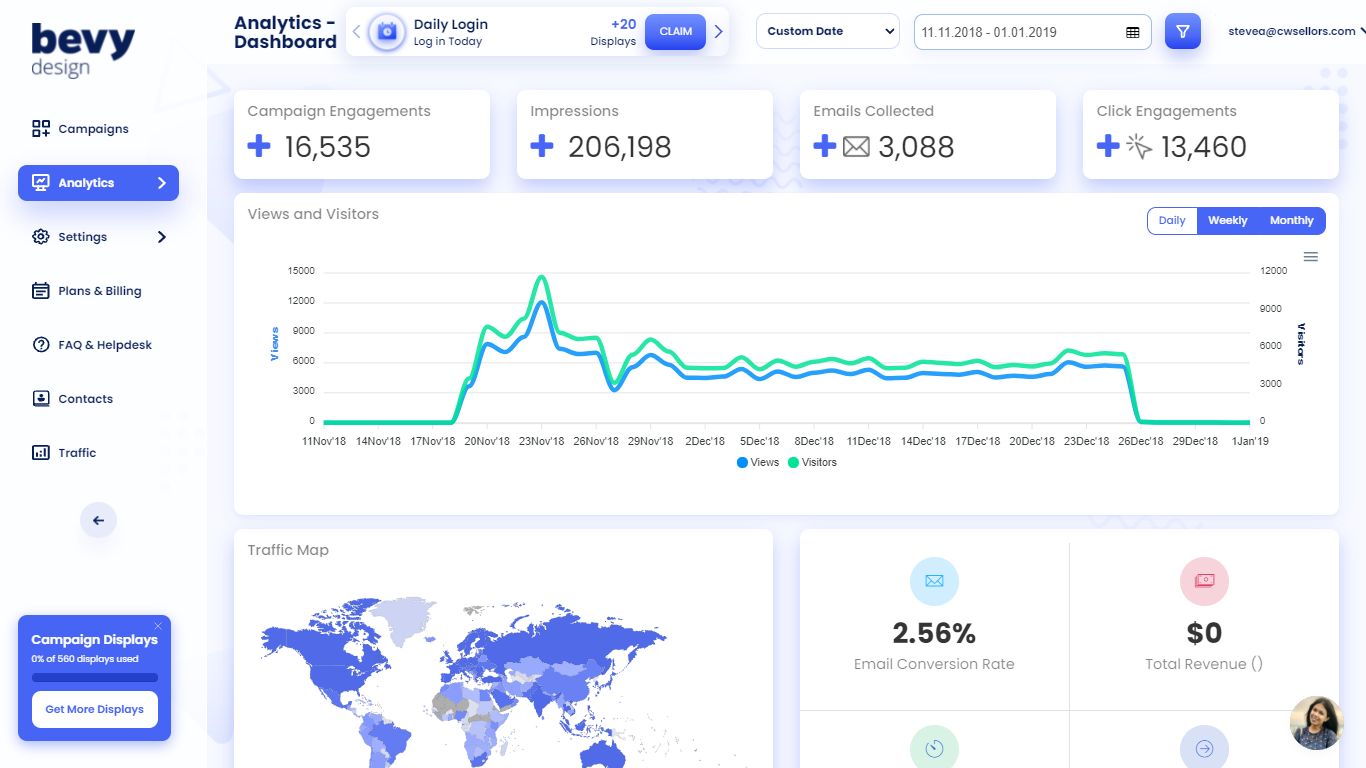
Dashboard
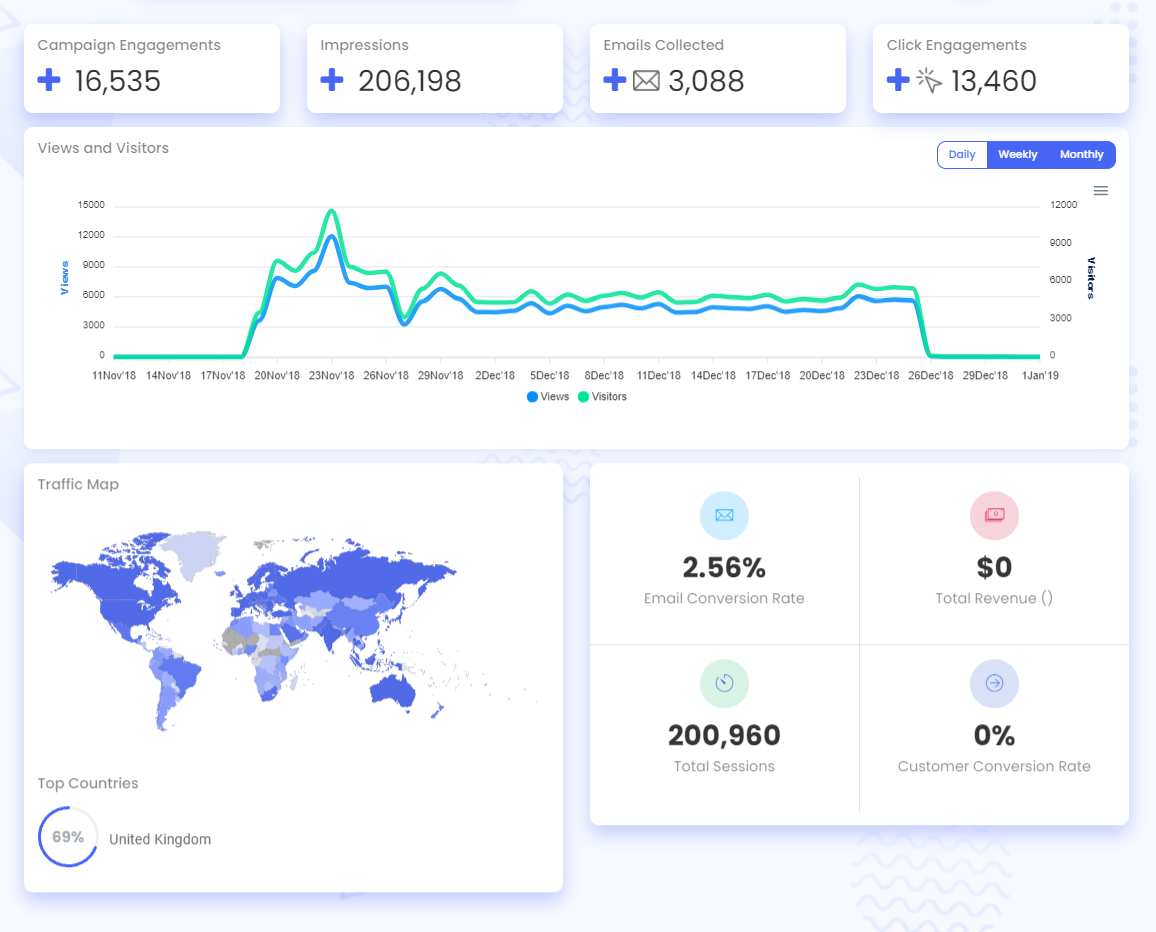
The Dashboard gives you an overview of how your campaigns are performing by showing visibility and engagement statistics for your campaigns.
- Campaign Engagements - Number of times users have engaged with your campaigns
- Impressions - Number of times your campaign has been displayed
- Emails collected - Number of email addresses your campaigns have collected
- Click engagements - Number of times your campaigns have been clicked on
- Views and Visitors - Line chart showing number of campaign views and number of unique visitors that have seen your campaigns
- Traffic Map - Chart showing the world map highlighting the countries from which users have viewed your campaigns
- Email Conversion Rate - Number of emails submitted as a percentage of number of campaigns displayed
- Total Viewed Campaigns - Number of times your campaign has been viewed
- Total Sessions Began - Number of sessions in your website
- Customer Conversion Rate - Number of customers (who made a purchase) as a percentage of number of visitors
Emails Collected
The Emails Collected section shows all analytics related to the collection of email addresses from users.
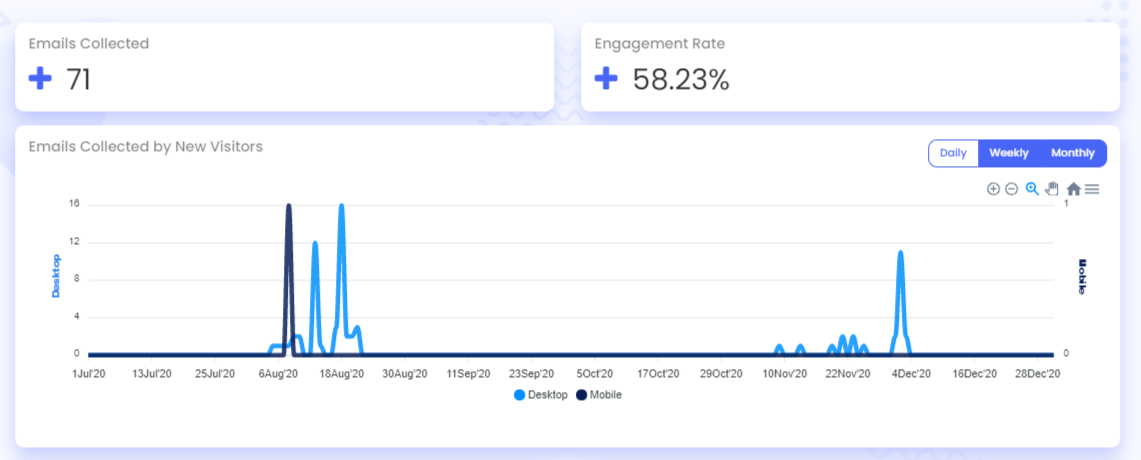
- Emails Collected - Number of email addresses collected
- Engagement Rate - Email addresses pas a percentage of campaigns displayed
- Emails Collected by New Visitors - Line chart showing number of email addresses collected from new visitors on your websites
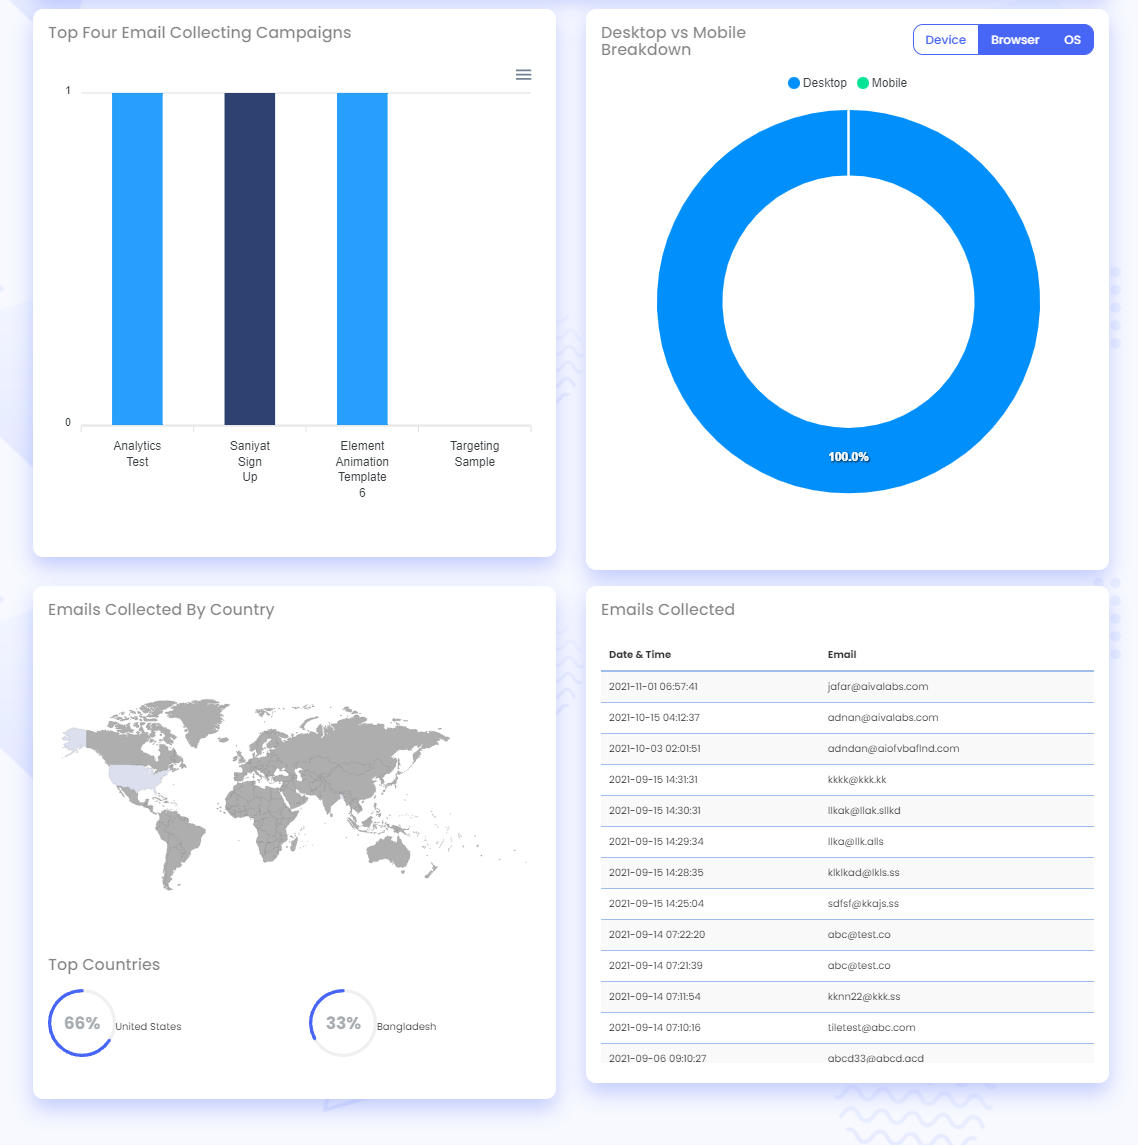
- Top Four Email Collecting Campaigns - Bar chart displaying the four campaigns with highest number of email addresses collected
- Desktop vs Mobile Breakdown - Pie chart displaying number of desktop and mobile users that email addresses were collected from
- Emails Collected by Country - Shows a world map highlighting countries from which email addresses were submitted
- Emails Collected - Shows the email addresses that were collected by your campaigns
Country
The Country section displays country related analytics information, allowing you to highlight the countries where your website or Shopify store performs the best.
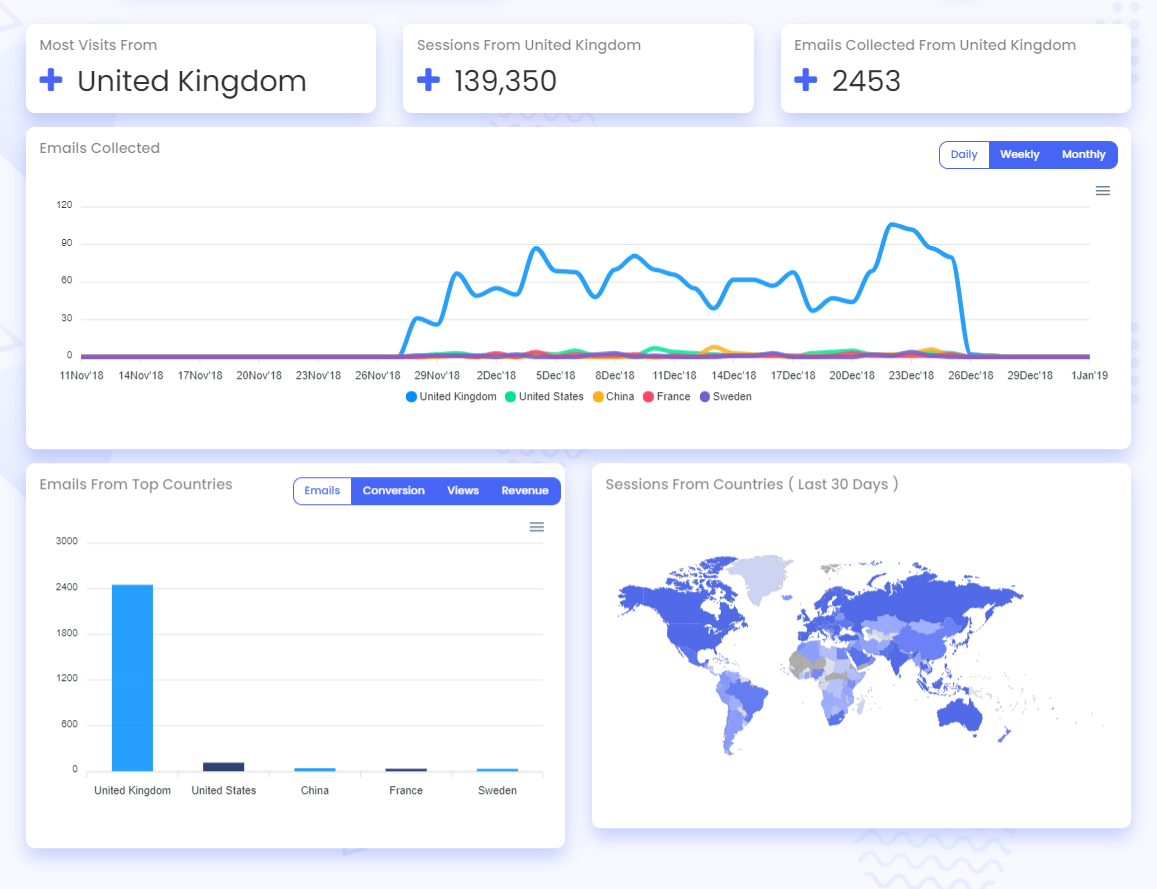
- Most Visits From - Country from which your website received most visits
- Sessions From Country - Number of sessions started in the country from which your website received most visits
- Emails Collected From Country - Number of email addresses collected from the country from which your website received most visits
- Emails Collected - Line chart displaying number of email addresses collected from different countries
- Top Countries - Bar Chart displaying email addresses collected, conversion rates, views, and revenue by country
- Sessions From Countries (Last 30 Days) - A world map highlighting countries from which sessions were started on your website
Conversions
The Conversions section displays conversion statistics for your website, allowing you to gauge the performance of your campaigns.
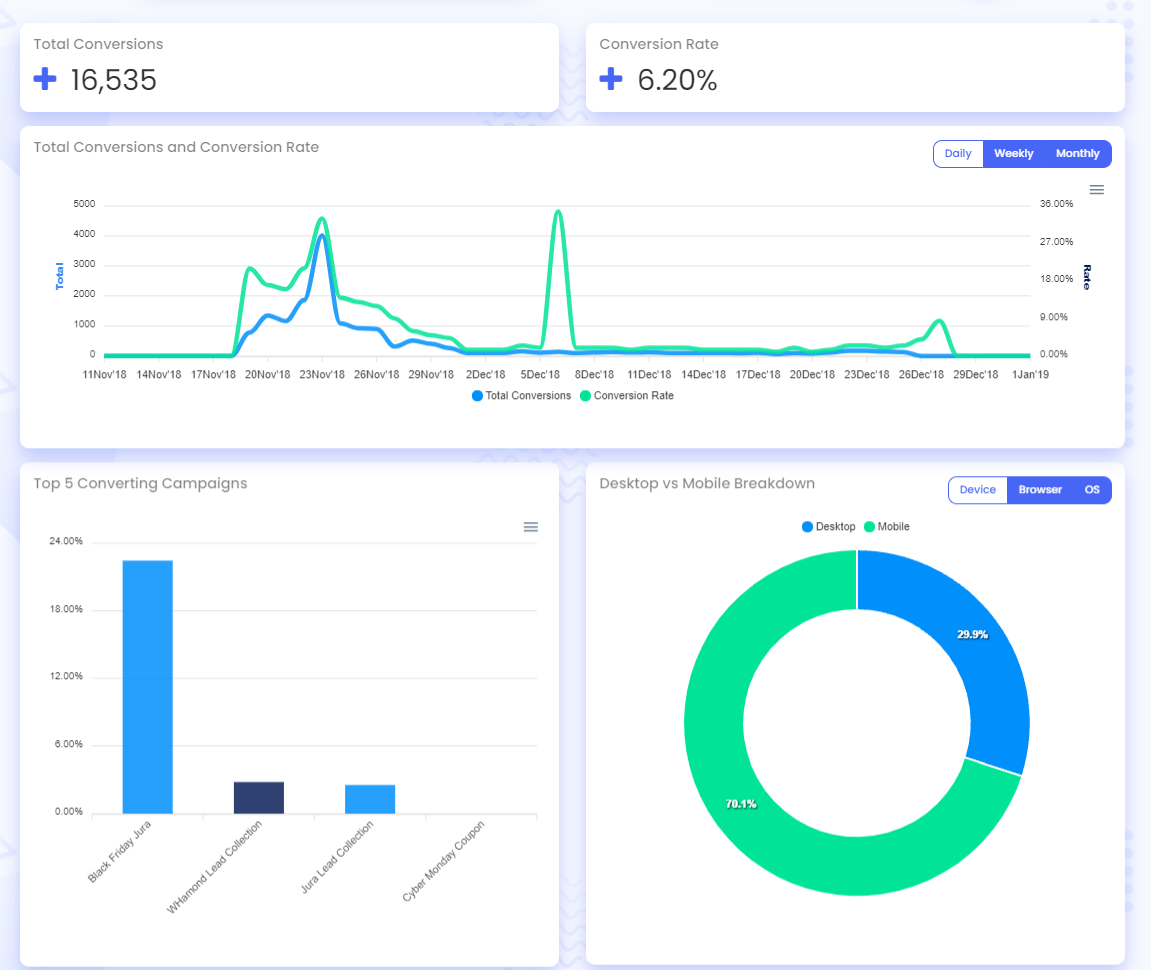
- Total Conversions - Number of visitors who purchased items on your website/Shopify store
- Conversion Rate - Number of customers (who made a purchase) as a percentage of number of visitors
- Total Conversions and Conversion Rate - Line chart displaying Total Conversions and Conversion Rate
- Top 5 Converting Campaigns - Bar chart displaying 5 campaigns with the best conversion statistics
- Desktop vs Mobile Breakdown - Pie chart displaying conversions of desktop and mobile users
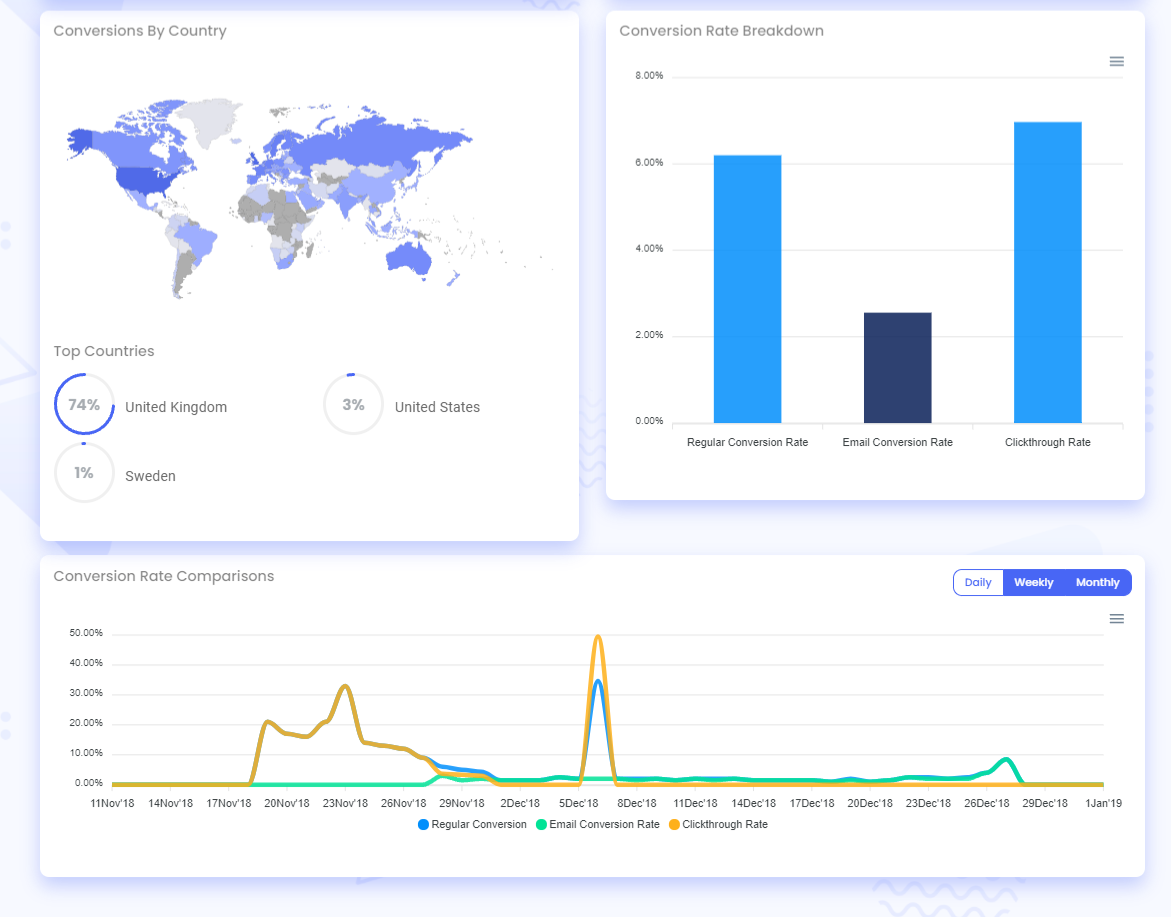
- Conversions By Country - World Map highlighting countries in which conversions were made
- Conversion Rate Breakdown - Bar chart displaying a breakdown of conversions by type (Regular Conversion Rate, Email Conversion Rate, Clickthrough Rate)
- Conversion Rate Comparisons - Line Chart comparing conversions by type (Regular Conversion Rate, Email Conversion Rate, Clickthrough Rate)
